Which Sharpe Two Analytics Should You Use?
Our options signals, volatility forecasts and analytics each help with a different part of the trading process. Here is where to start, whether you are exploring the platform yourself or putting your trading agent to work.
We often say that trading should be a data-driven business, with room to exercise discretion within that framework. When we started Sharpe Two, we wanted to solve a familiar problem: spending hours looking for a trade when there was no worthwhile opportunity in the first place.
How many times have we done this? We know a ticker well, torture a dataset of familiar metrics, add a sprinkle of technical analysis and macro commentary, and squint hard enough to find a position that expresses our view. In the end, we have simply worked very hard to justify a trade that never deserved our attention.
There is little point doing all that due diligence if we are looking in the wrong place. Familiarity with a ticker is useful, but it cannot manufacture an edge.
Sharpe Two helps us direct that effort towards opportunities worth investigating. Perhaps KRE, ASHR or EEM rarely feature on your watchlist. Yet they regularly appear on our radar, so why not yours? The point is to consider them when the conditions become interesting, then decide whether and how to trade them.
Where should we look for an opportunity?
- Screens stocks and ETFs on whether implied vol is likely to exceed the realized vol that follows.
- Gives each session four or five names worth investigating.
- The Long Short screener compares volatility across instruments for pair trades.
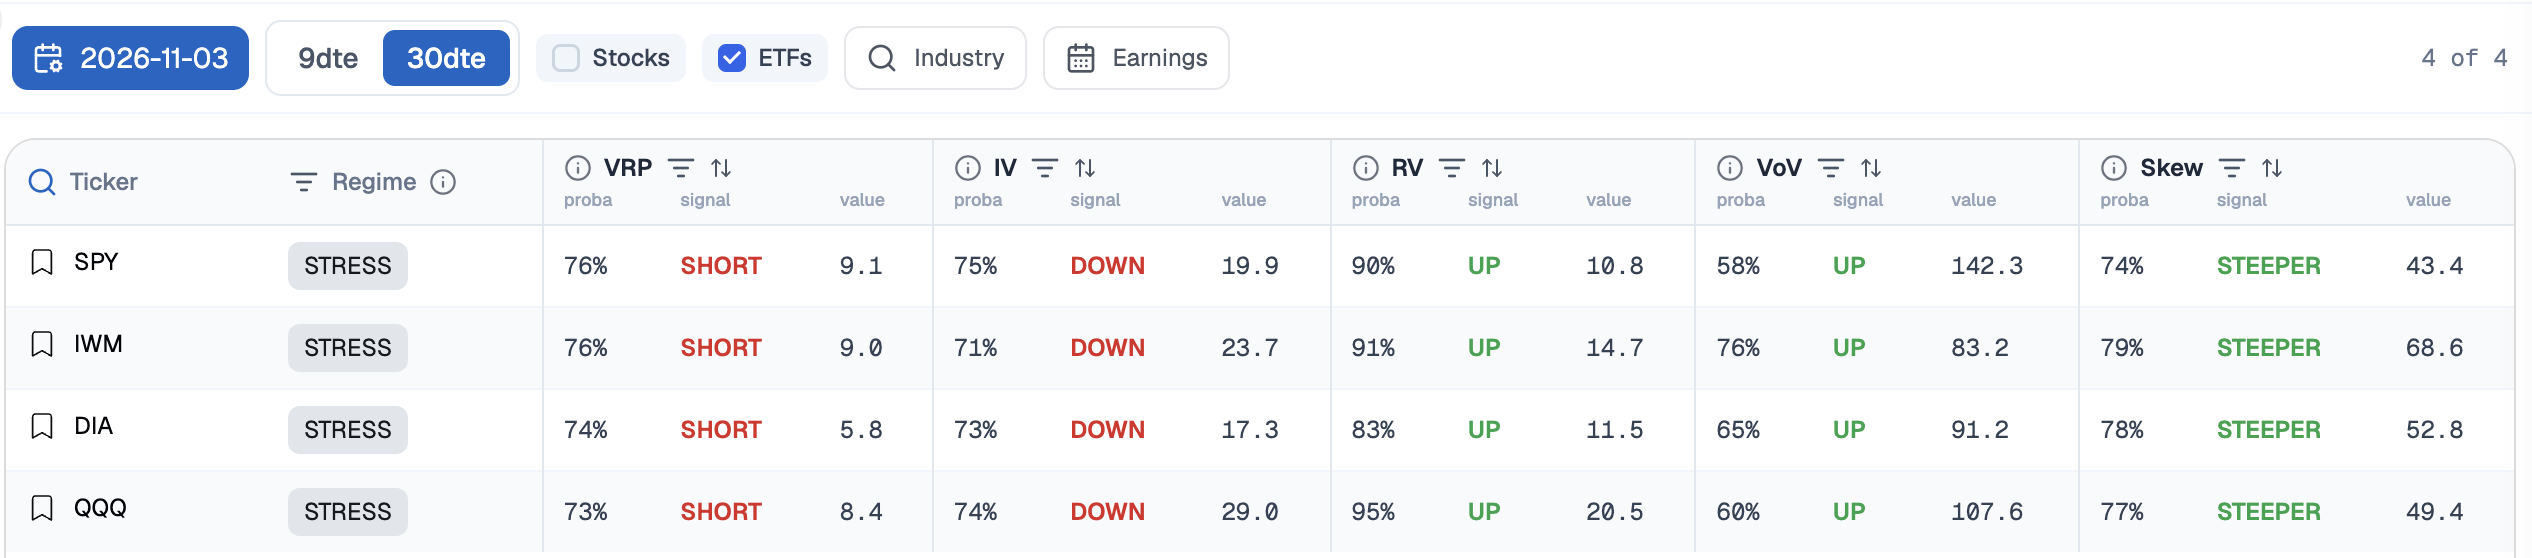
For a trader selling volatility, one question sits at the centre of the decision: does the implied volatility we can sell today have a good chance of exceeding the realized volatility that follows over the life of the option?
That relationship underpins the variance risk premium. It is also our north star at Sharpe Two.
Under Research → VRP, we screen stocks and ETFs around precisely that question. The signal and its probability help us identify where the volatility on offer looks attractive relative to what may come next.
This saves time. It also helps with the classic “we know a handful of tickers really well” problem. We can understand a name perfectly and still find ourselves trading it when the conditions offer very little.
Our customers like this page because it gives their research a starting point. Open it, identify four or five names worth considering, and spend the rest of the session deciding which ones fit and how to trade them.
For traders looking at relative value, our Long Short screener compares volatility across instruments. When one looks expensive relative to another, a volatility pair trade may deserve a closer look.
We also offer packaged strategies built around specific signals and forecasts. If you prefer to start with a defined trade rather than construct one from scratch, strategies such as Nightcall and VRP Bandit are designed for that approach.
Is the volatility actually expensive?
- Compares implied and realized vol across maturities, live.
- Shows which expiries are moving and where the premium is most expensive.
- The Vol Surface adds strikes, so you can price each exposure.
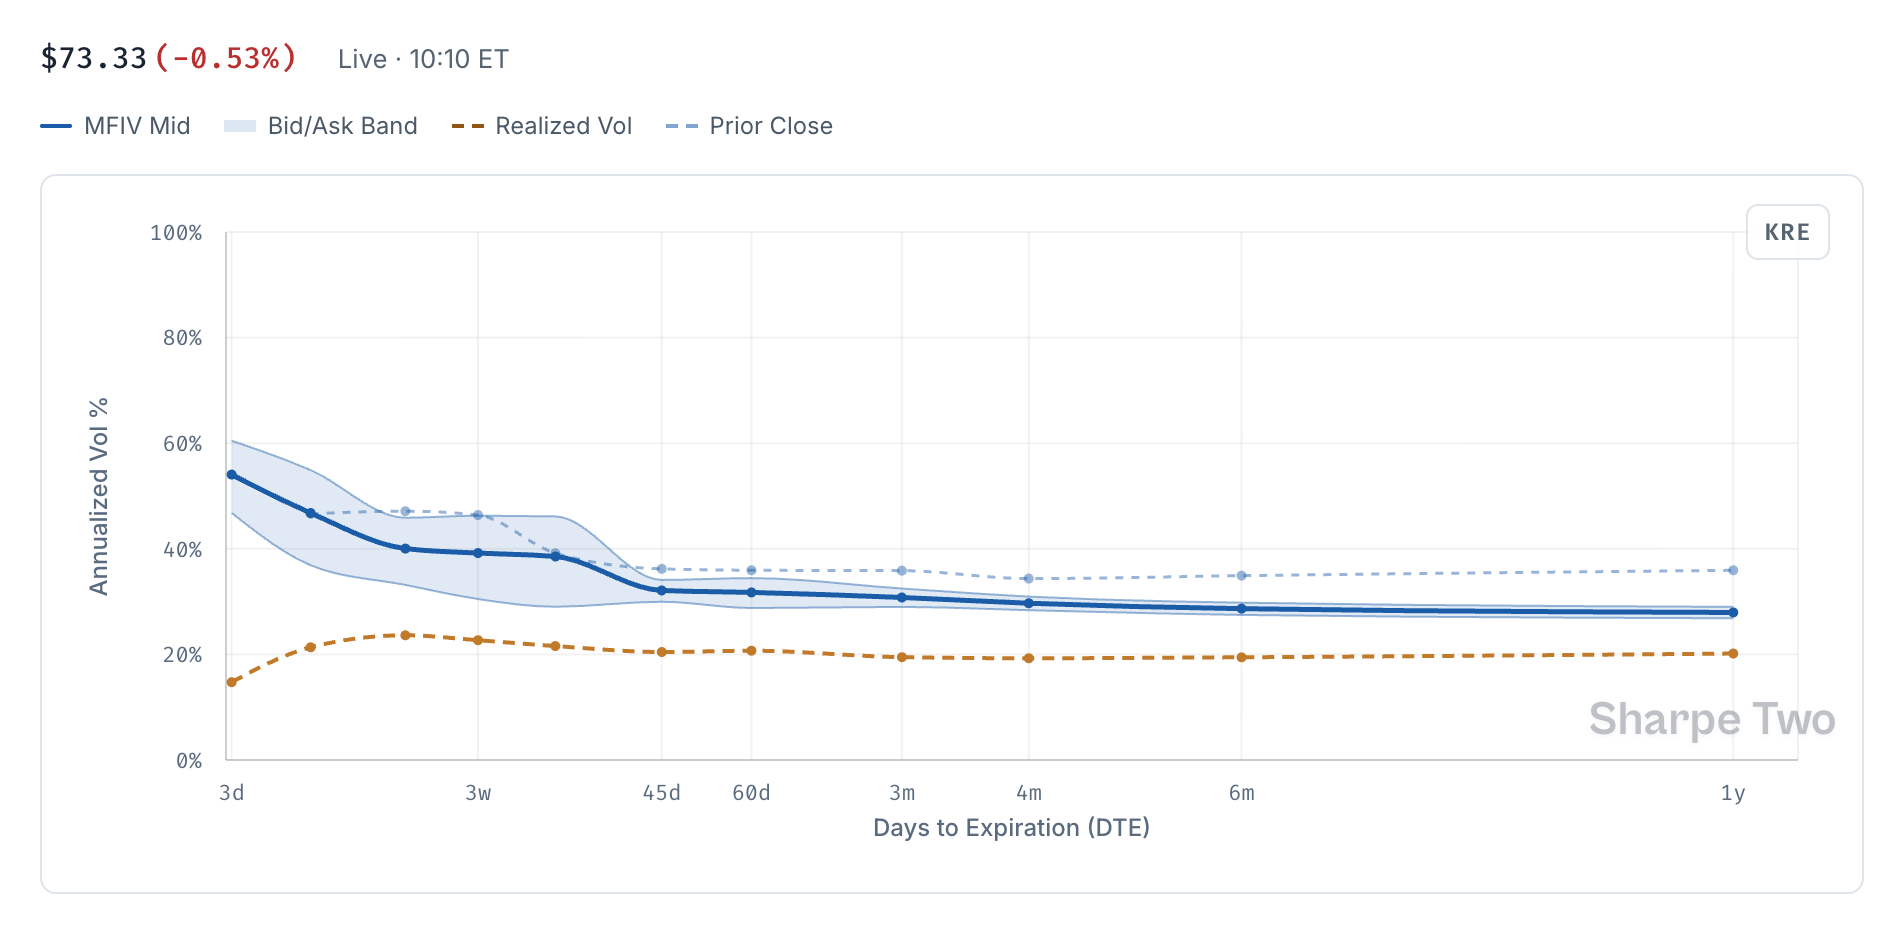
Once we have found something worth our attention, there is room for discretion and creativity. But we still need the right data in front of us.
VRP Central shows how implied and realized volatility compare across maturities, and how the implied volatility term structure is evolving in real time.
During a volatility spike, the premium that caught our attention can change while we are still weighing the trade. We want to see whether it is holding up, increasing or already fading, and how the move is spreading across expiries. That live view helps us decide whether to enter, wait for a better price, or reassess a position we already hold.
How often have we opened social media to find a flood of negative news and apparently clever commentary that does not match what the market is pricing? And how often have we let a good trade go because the mood of the conversation overwhelmed the evidence?
With the term structure in front of us, we can see which expiries are moving, whether the curve is steepening or flattening, and where the premium is the most expensive. That helps us choose an expiry that fits the view.
The Vol Surface adds the strike dimension. Sharpe Two constructs its own volatility surfaces so we can examine how options are priced across both strikes and maturities.
Perhaps short-dated downside protection looks particularly expensive, and a longer-dated put offers an interesting hedge. Perhaps put skew is pronounced and we also have a bullish view, making a short put and a long call worth comparing with a strangle. The surface helps us see what we are selling, what we are buying, and the price of each exposure.
We have already identified a potential edge. This is where we work out how to express it. Our SPY volatility-spike case study walks through that choice using a strangle, a calendar and an iron condor.
What could volatility do next?
- Forecasts cover implied vol, realized vol, vol of vol and skew.
- Each gives a predicted level or a probability of direction over a stated horizon.
- They support the VRP signal; they don’t replace it.
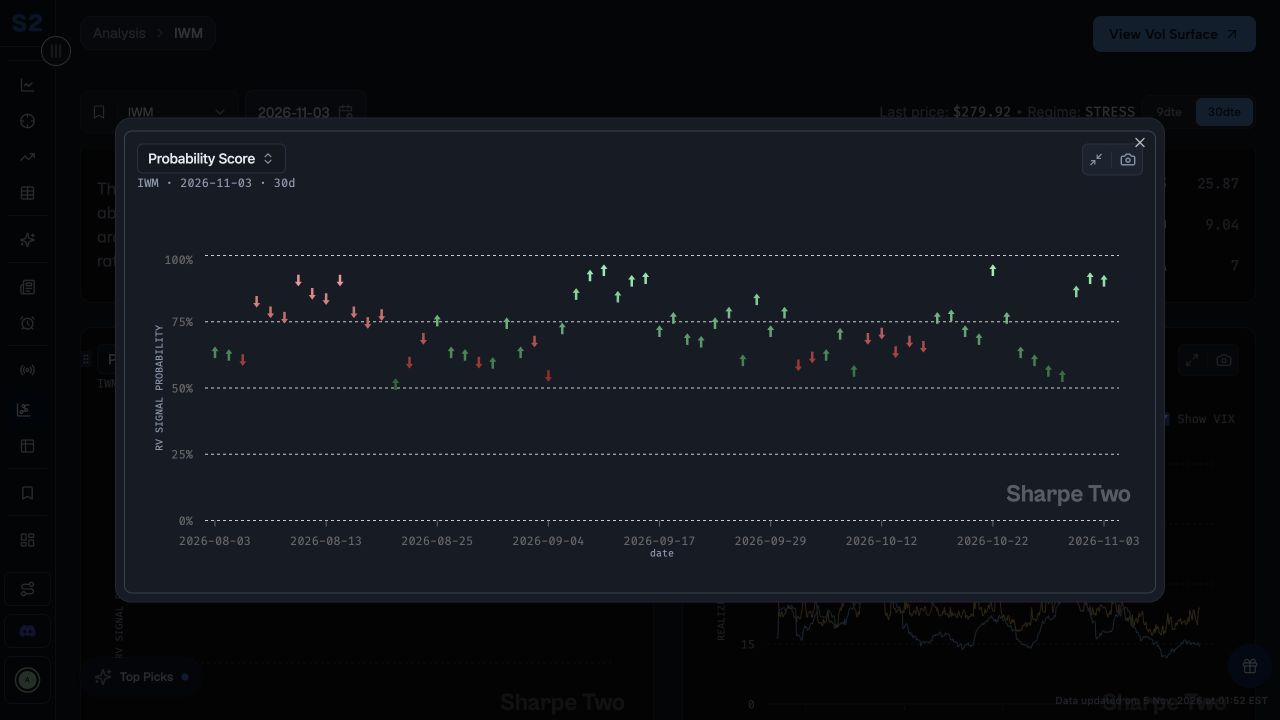
A term structure tells us what the market is pricing today. A forecast helps us form a view about what may happen while we hold the trade.
That distinction matters in an increasingly competitive market. Live analytics are already widely available, and that trend is only going to accelerate in the age of agentic trading. The next question is what we expect to change, and how that should affect the position we build.
Sharpe Two provides forecasts for implied volatility, realized volatility, volatility of volatility and skew. Depending on the forecast, we can examine a predicted level or a probability of direction over the stated horizon.
Suppose the short-volatility signal is attractive, but implied volatility is also likely to rise over the next few days. We might choose a smaller position, particularly if volatility of volatility is expected to increase too. We could have a good reason to sell volatility and still expect an uncomfortable path into the trade.
Conversely, a forecast that realized volatility will cool may give us more confidence in the amount of risk we are willing to take.
We think of these as supporting forecasts and probabilities. Our starting point remains the likelihood that implied volatility will exceed subsequent realized volatility. The additional forecasts help us decide what sort of exposure we want, how much of it to carry, and what to watch along the way.
We explore that distinction further in Why You Need an Opinion on Future Realized Volatility.
What is behind the model's view?
- Key drivers show which observations move each forecast.
- The written analysis explains the forecast in plain English.
- Use them to agree with the model, refine the view or pass.
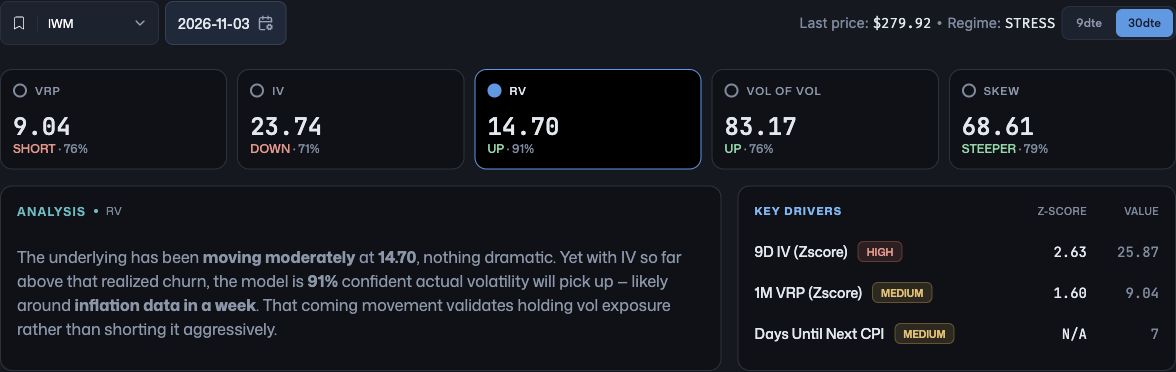
Many traders hesitate to trust AI with a trading decision because it feels like a black box. A model produces a signal, attaches a probability, and leaves us wondering what it has actually seen. When the position starts losing money, how do we know whether the original reasoning still holds?
That is why we show the key drivers alongside our forecasts. These interpretable features let us see which observations are influencing the model's view, so we can question a signal before putting money behind it.
In the IWM example above, the model gives a 91% probability of realized volatility rising. The written analysis discusses the gap between implied and realized volatility and approaching inflation data. Beside it, the key drivers show short-dated IV, the one-month VRP and the time until the next CPI release. We can see the forecast, read the explanation and inspect its inputs in one place.
The explanation can build confidence in the position. It can also give us a reason to challenge it. We are still the portfolio manager, and we may know something about a recent development that changes how we interpret those inputs.
That is a useful place to exercise discretion: understanding the model's reasoning well enough to agree with it, refine the view, or pass.
As trading becomes more agentic, we are also adding plain-English explanations across the platform. Think of them as short notes from an analyst, helping a trader or an agent connect the observations to the trading question.
What actually made or lost money?
- Splits a trade’s result into delta, gamma, theta, vega and the other Greeks.
- Shows whether a short-vol profit came from theta or from direction.
- Over many trades, shows which setups earn for the reasons you intended.
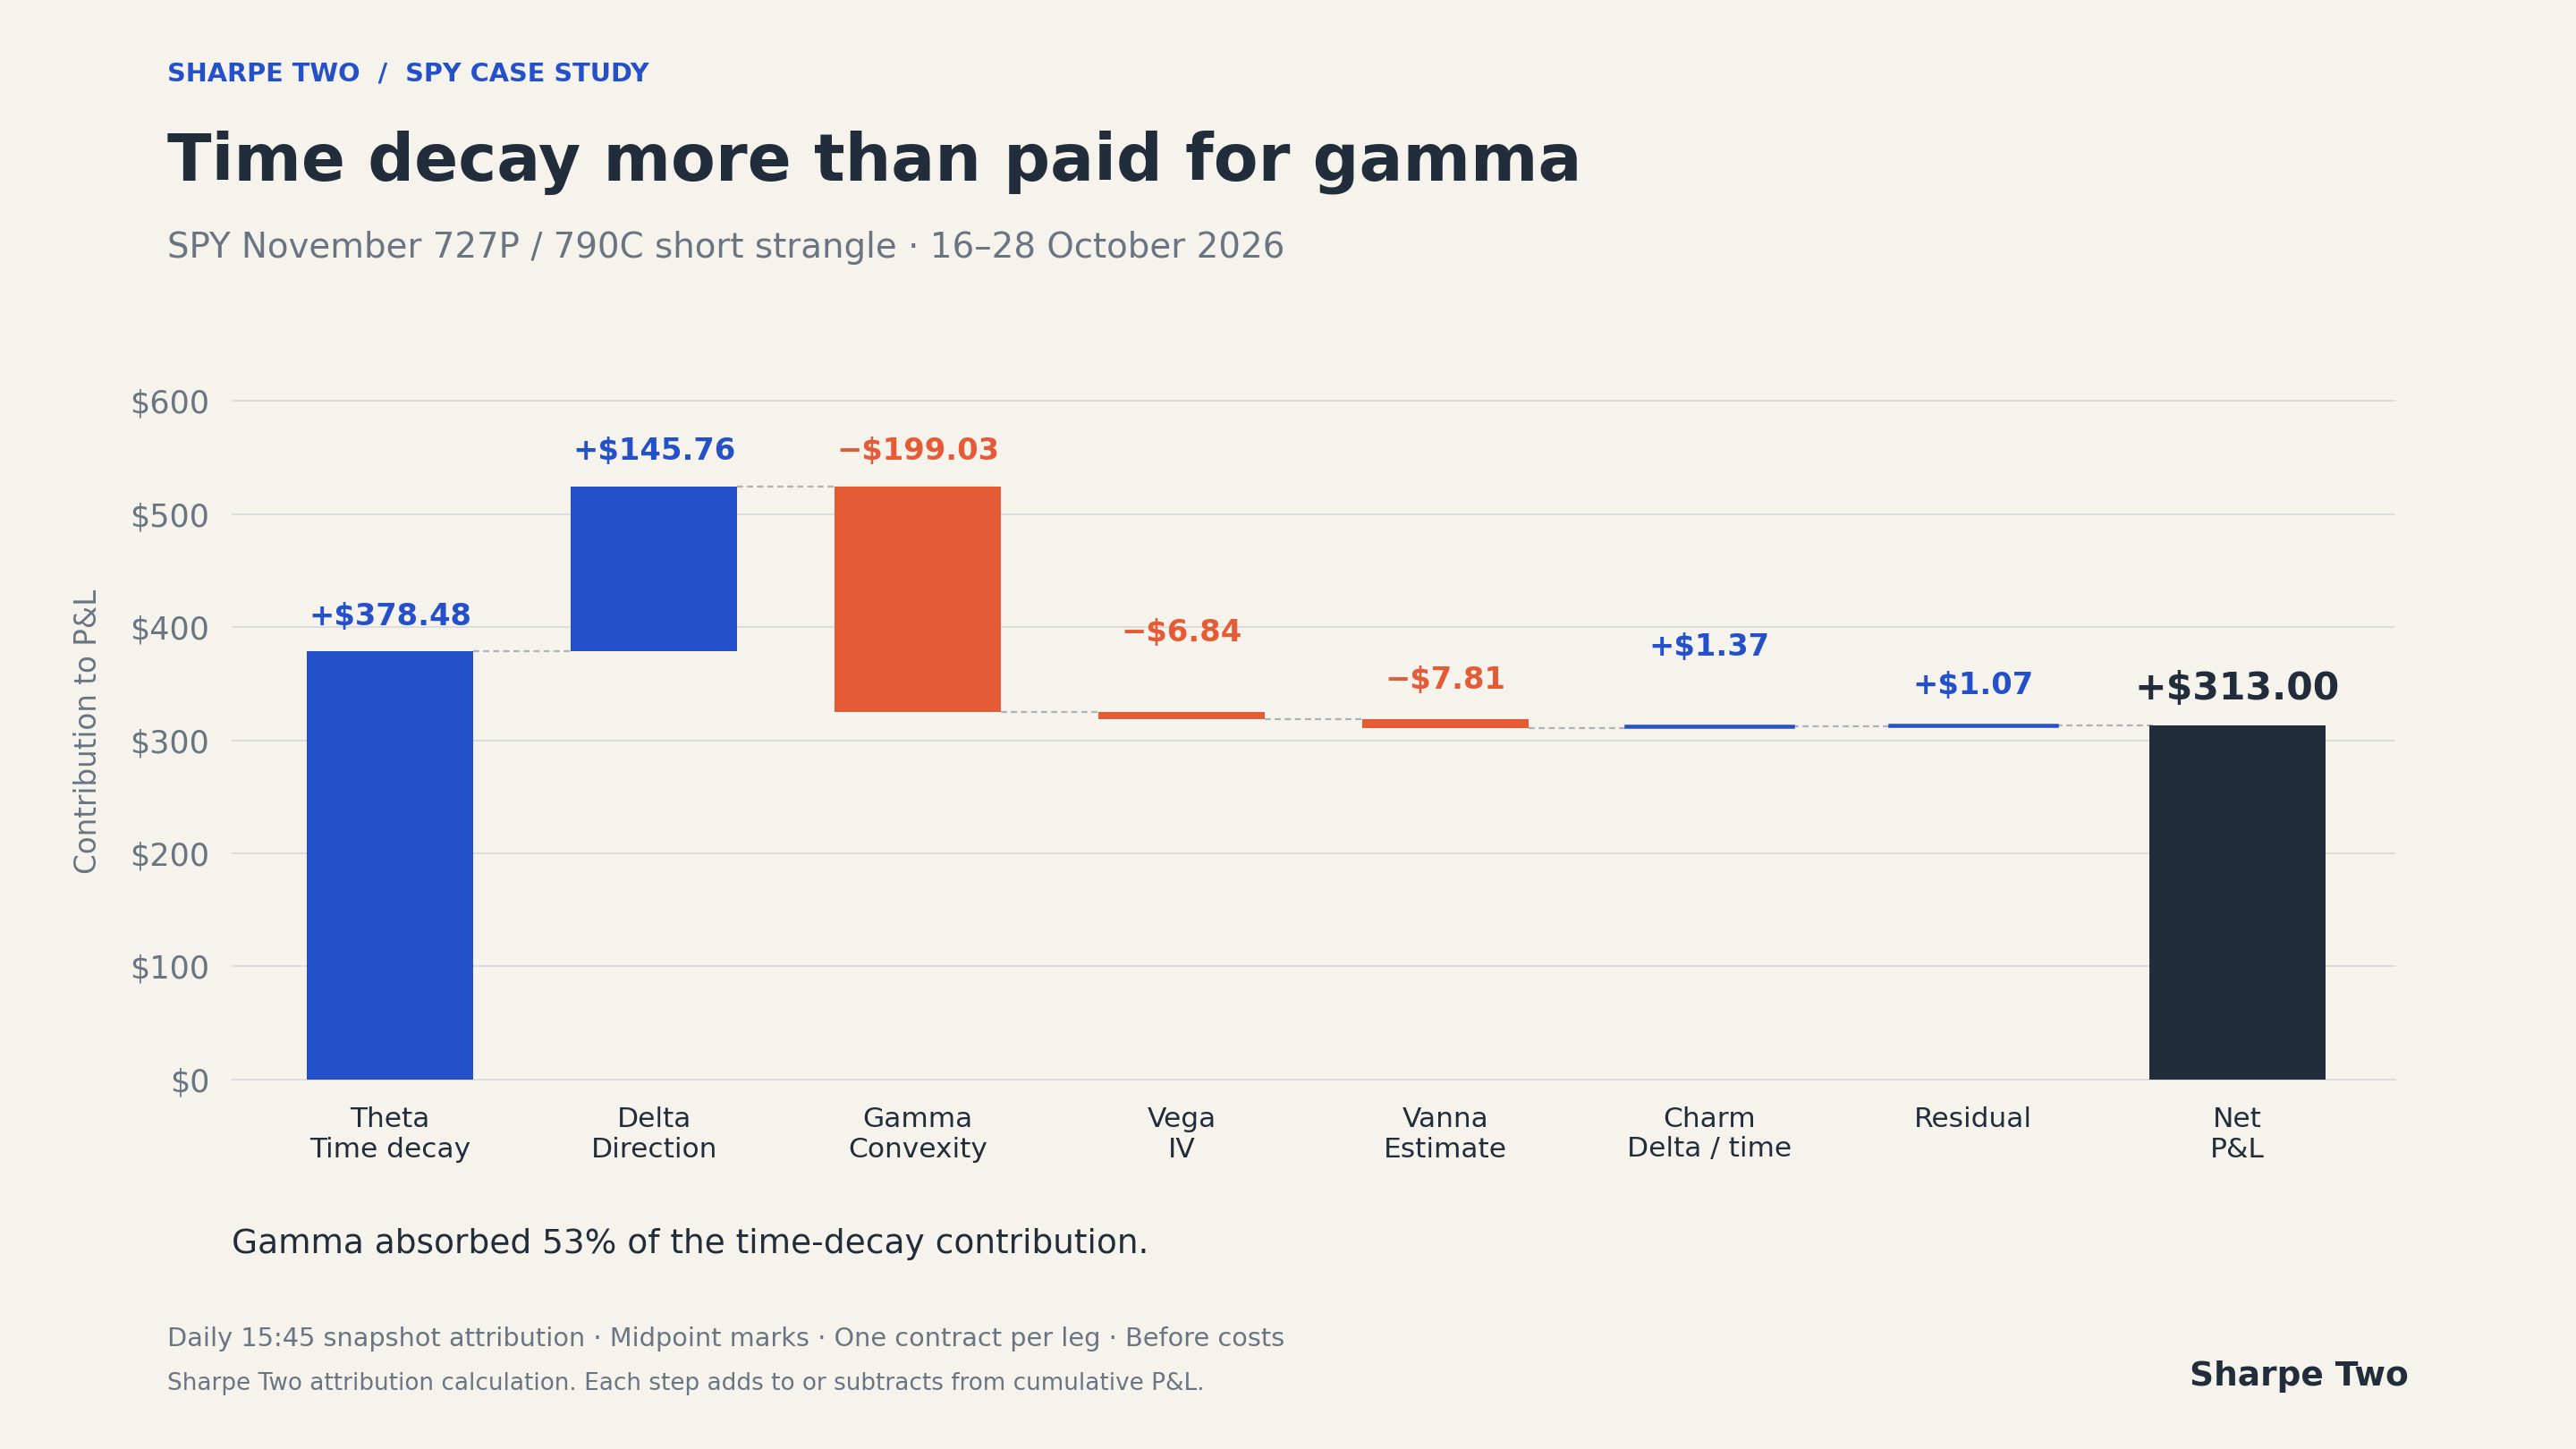
We are particularly keen on this one. Too many traders finish an options trade knowing the result but having little idea how they got there. That makes it hard to decide what to repeat and what to change.
Sharpe Two's P&L Attribution breaks the result down into contributions from delta, gamma, theta, vega and other Greeks, so we can compare what happened with what we expected.
If we entered a trade to sell volatility and most of the profit came from favourable directional exposure, we should understand that before repeating it. Perhaps the direction was part of the thesis. Perhaps we got lucky.
For a short-volatility position, we want to see how much theta earned, what price movement cost or contributed through delta and gamma, and how changes in implied volatility affected the result. In our SPY case study, time decay more than covered the gamma drag, while delta and the other contributions completed the picture.
Over a series of trades, that analysis helps us identify the setups in which the position is earning money for the reasons we intended. It also helps us understand losses. A trade can express a sound view and still have a difficult path; attribution gives us the detail needed to examine it.
Find the next trade worth your time
The next opportunity may be in a ticker you rarely follow.